The starting point
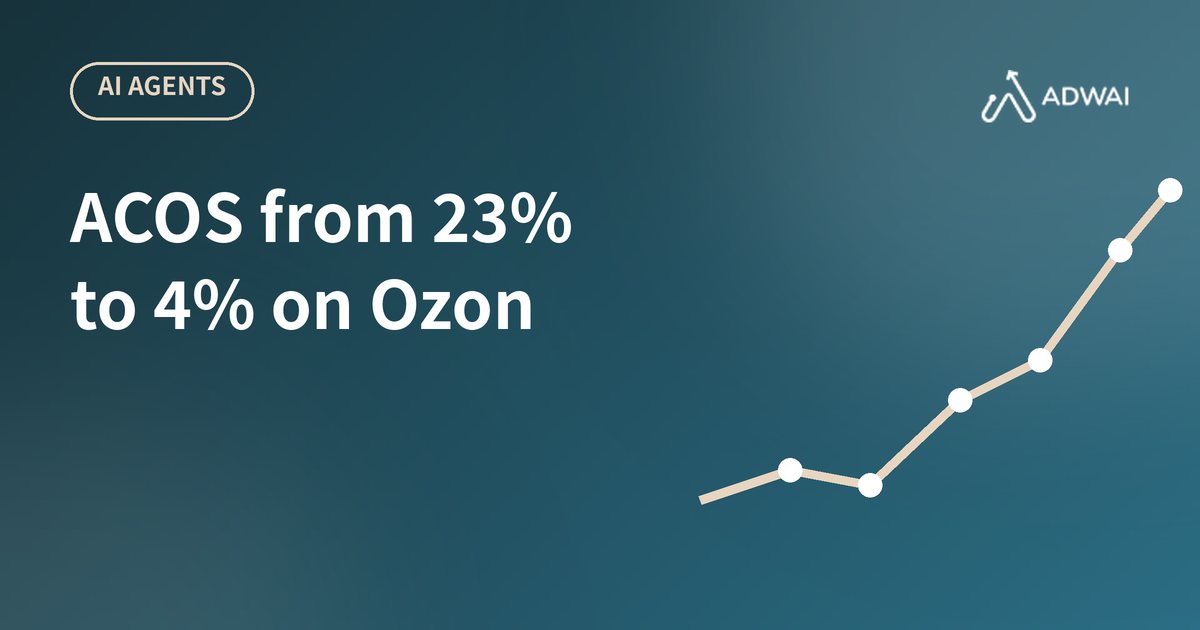
A partner came to us with one goal: bring down the overall ad cost share (ACOS) on Ozon. At the start it sat at roughly 23-25%. We ran the campaigns through Perplexity, got two recommendations, implemented them, and tracked the result in the Ozon dashboard over a period from late July to early October.
Hypothesis one: 23% to 8%
We framed the task for the model directly: we need to lower ACOS, focus on what has to improve. The first hypothesis it returned was enough to move the number in steps - first to 20.76%, then to about 14%, then close to 8%.
That is a 15 point drop from the starting figure, already a strong result.
Hypothesis two: 8% to 4%
Eight percent did not look like the floor. We ran the campaigns and reports through the model again, asked for a further round of hypotheses, and started implementing them.
This stage behaved differently. Ad spend and customer acquisition cost ticked up for a while. The changes needed about four weeks to play out: week by week we adjusted product cards, logistics, SEO and ad settings. From week four into week five ACOS started falling again and came back to about 8.4%. By week six after the second round it reached 4%.
We started in July at 23% and finished in October at 4%.
Why Perplexity fits business tasks
Perplexity is not a chat toy. For our purposes the value is that it analyses data, searches for solutions on top of that data and proposes strategies. It explains the logic: given these metrics, you can take these three actions and reach this result.
Our work always has to rest on numbers, and this model reads numbers in depth. The large volume of digging through figures that we used to do by hand now takes it about five minutes. I think of it as an analyst who can process a big dataset and generate hypotheses from it.
How we used to analyse ad reports
We exported every number into large weekly and monthly reports - close to ten of them - and analysed the whole set. Each analysis took about two to three days. Some reports went faster, some slower, depending on volume.
We could not do this often. It takes two or three days of undivided attention, with no calls and no other tasks. In the Ozon seller dashboard alone, inside the campaigns, you do not see the full picture, so we went deeper: Excel, filters, formulas.
That approach produced errors - a formula breaks, a range is not filled down, something is missed. It also produced fatigue and burnout, because the volume of information and analysis was huge. With many products the volume multiplied. We did not love this work; we did it because campaign efficiency and store sales depended on it.
Hypotheses, dead ends and the cost of manual work
Often we would spend several days on an analysis, isolate hypotheses, and they would not work. That is normal: you test a hypothesis and it does not always pay off. In fact, most hypotheses you isolate do not work.
At some point it is hard not to ask why you spent days on something that led nowhere. Manual work was necessary, but it was expensive.
What we do now: reports plus a prompt
We load the ad reports, the Ozon dashboard exports and the goals into Perplexity, then apply a prompt we built specifically for this task. A prompt is simply the request you write to the model.
We upload the files plus a long prompt that spells out step by step what we want and what has to be done. Treat the model like a new junior employee who knows nothing: you have to write the task out in full. Attaching a file and writing "analyse this and give me recommendations to grow sales" does not work.
People often comment that the model is stupid and understands nothing. It is not stupid. It needs the right task, the right prompt and the right context. Only then does it deliver.
What the analysis surfaces
Once the files and the prompt are in, the model analyses every campaign: CTR, ACOS, conversions by campaign, by format, by settings inside each format and by product. It runs a deep analysis and finds the points where budget leaks.
A high ACOS often does not come from a setting being wrong. It comes from some campaigns overspending: they absorb a large share of the money without delivering the result, while campaigns that could produce good sales and good ACOS do not get enough budget.
When the model sees these leaks, it proposes a new testing strategy and writes out the steps to lower ACOS. It also gives a plan of fixes for each format: if click-based campaigns are underperforming or set up incorrectly, it tells you what to correct. The whole job takes five to seven minutes in a deep research mode.
The interface
In Perplexity you enter the prompt, attach the files (reports or anything else), and choose the mode. For this work we skip the basic analysis and use the deeper modes such as research and labs. Then you hit start.
You can also dictate the prompt by voice instead of typing it. The interface is simple.
What the ACOS reduction actually means
Traffic volume stayed at the same level. Lower ACOS does not mean we spent less on ads or earned less. It means the advertising started working almost five times more efficiently.
And all of it without manual analytics, without Excel, without the evening headache after a day of digging through numbers and finding nothing.
The same approach on other marketplaces
Perplexity is not an Ozon-only tool. The same principles and the same kinds of reports apply on Wildberries and Yandex Market: export the reports, set the task correctly, and the model does the work. Once you have learned to do this for one marketplace, you can carry the method over to other ad platforms and channels.
Conclusion
With Perplexity we cut ad cost share on Ozon from 23% to 4% without increasing the budget, by making the advertising more efficient. The model replaced the routine analysis and saved both time and money.
Think of it as a marketing analyst that works around the clock, does not get tired and does not ask for a raise. Learn to use it and to write the right prompts, and you can get the same kind of results.